正文
我们有各种定制仪表板,旨在提供有关银行核心应用程序、模块间和模块内依赖关系和使用记录的信息。 我们可以有效地可视化单独服务之间的相关性。 这使我们能够清楚知道某个服务中更改或中断将对其他服务和应用程序产生怎样的影响。 以下是仪表板的一些示例,其中包含多种应用场景:
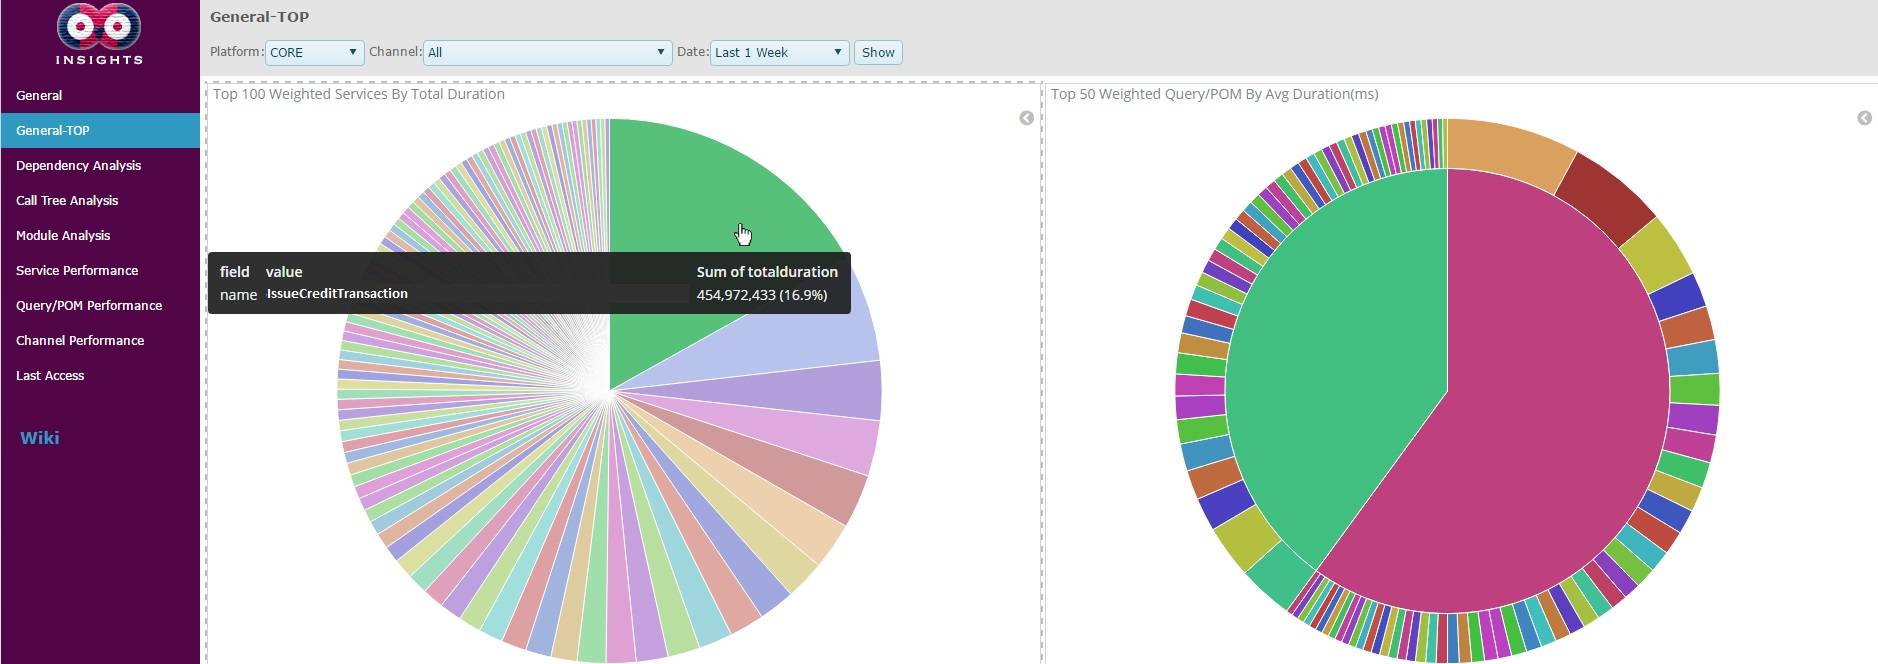
Suppose an IT monitoring specialist is set out to decrease the overall response time of the core banking system. They begin by examining the General-TOP dashboard of insights to see the most time-consuming transactions. They quickly observe that the credit issuance transaction, IssueCreditTransaction, of the mobile banking application lasts exceptionally long.
如果IT监控专家想要降低核心银行系统的整体响应时间。他们首先会检查General-TOP仪表板以了解最耗时的交易。观察后发现手机银行应用程序的信用发行交易(IssueCreditTransaction)过程耗时很长。
They inform the owner of the transaction, the front-end development team of mobile banking, about the discovery. A front-end developer from the team goes on to analyze this particular transaction in terms of its dependencies.They find out that 60% of the time spent in this transaction takes place in the
CREDIT_ISSUANCE_SERVICE
, which is dominated by the
CREDIT_ISSUANCE_DOCUMENT_SERVICE
. Hence, they easily pinpoint the low performance to the
CREDIT_ISSUANCE_DOCUMENT_SERVICE
:
他们会通知交易所有者(移动银行的前端开发团队)相关信息。 来自该团队的前端开发人员将继续根据服务之间的依赖关系分析耗时较长的原因。他们将会发现在此交易中60%的时间是花在CREDIT_ISSUANCE_SERVICE中的(由CREDIT_ISSUANCE_DOCUMENT_SERVICE主导)。 因此,他们会将工作重心放在CREDIT_ISSUANCE_DOCUMENT_SERVICE:
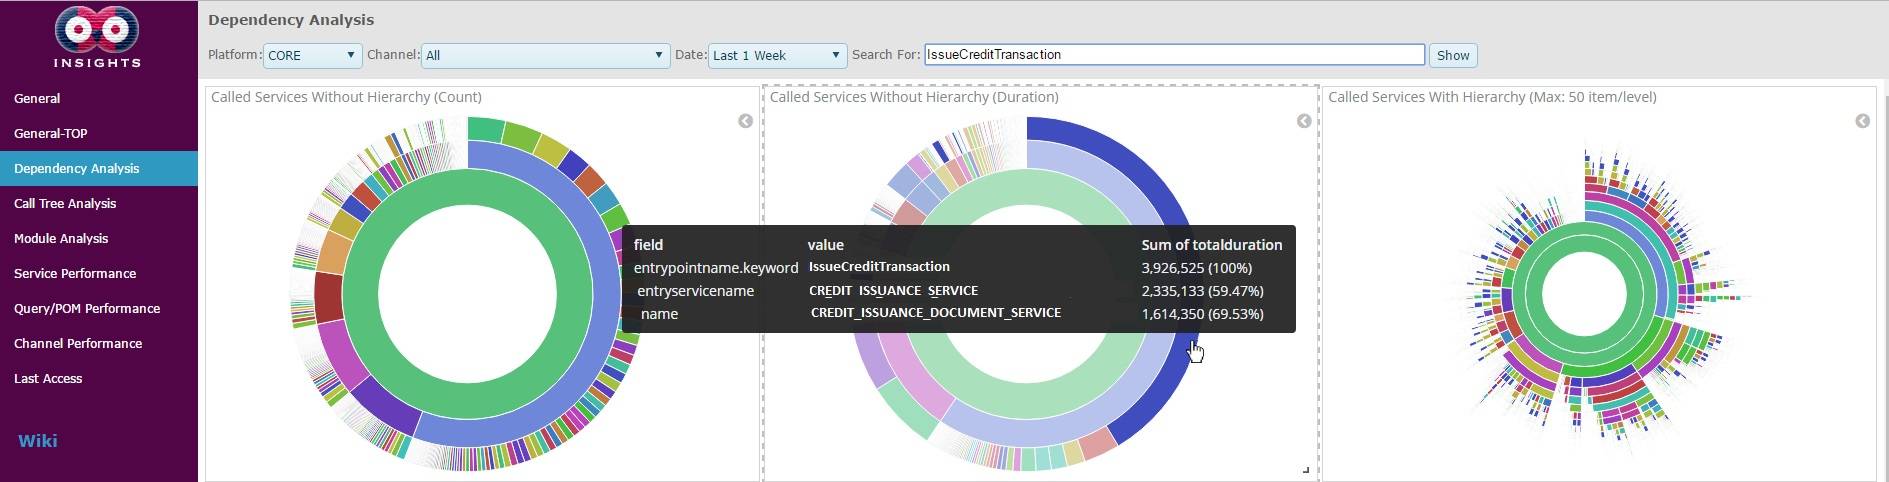
Figure 3: The dependency tree of the transaction in the above JSON. The left-most diagram shows the call counts of the inner services in this transaction. The diagram in the middle shows the total time elapsed in the inner services, the largest slices being the main burdens on the response time of this transaction. The right-most diagram shows the tree structure of this transaction, with all the possible paths from the root to leaves illustrated.
图3:上述JSON中的事务的依赖关系树。
最左侧的图表显示了此事务中内部服务的调用计数。中间的图显示了内部服务的总时间,最大的切片是此次交易响应时间最长的部分。 最右边的图表显示了该事务的树结构,其中包含从根到叶的所有可能的路径。
The mobile front-end development team asks the owners of the CREDIT_ISSUANCE_DOCUMENT_SERVICE, loans back-end development team to investigate the issue. A back-end developer starts examining the said service by searching it in the Service Performance dashboard. The analysis unveils two separate issues, a great deal of time is spent in the code, and the SELECT_CUSTOMER_ISSUANCE_INFORMATION query is costly.
移动前端开发团队要求CREDIT_ISSUANCE_DOCUMENT_SERVICE的所有者(贷款后端开发团队)检查此问题。 后端开发人员通过在服务性能仪表板中进行搜索来检查上述服务。 该分析揭示了两个问题:代码中花费了大量时间、SELECT_CUSTOMER_ISSUANCE_INFORMATION查询成本高昂。
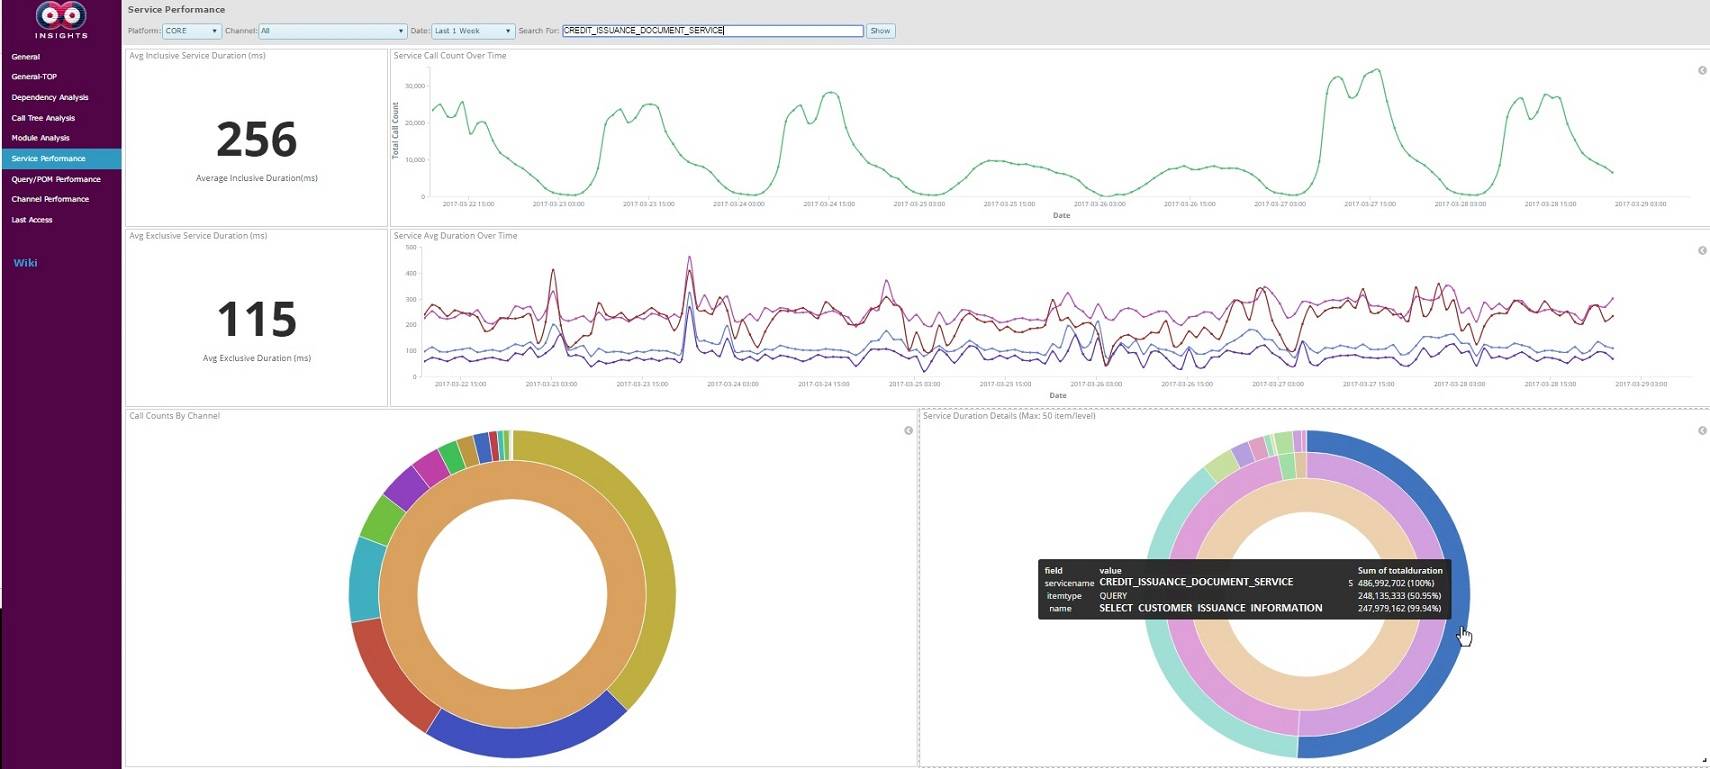
Figure 4: The detailed service analysis of CREDIT_ISSUANCE_DOCUMENT_SERVICE in the example JSON data. In the upper part, you can see the average durations of this particular service including or excluding the times elapsed in the inner services it calls. In the bottom right diagram, the layers in which this service passes time are shown.
For the performance problem of the code, the backend developer makes some changes for optimization, and requests for a test before deploying the code to production. Testers, given the changed service, try to list the test cases. They look through the call tree analysis to see which entry points lead to this service being called, through which path(s), and proceed to test these scenarios.
图4:在示例JSON数据中对CREDIT_ISSUANCE_DOCUMENT_SERVICE的详细分析。
在上半部分,您可以看到特定服务的平均持续时间,包括呼叫内部服务经过的时间。 在右下图中,显示了此服务通过时间的图层。
对于代码的性能问题,后端开发人员进行一些优化更改,并在将代码部署到生产之前进行测试。 测试人员考虑到更改的服务,尝试列出测试案例。 他们通过调用树分析来查看哪个入口点导致这个服务被调用,查看可以通过哪个路径来测试这些案例。


