正文
}))
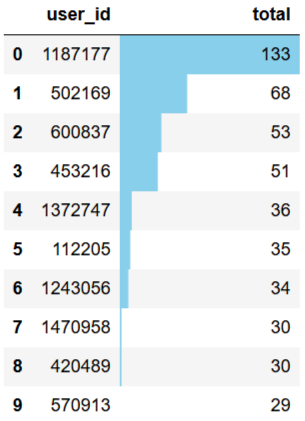
# 消费次数前10客户
    topbuyer10 = total_buy_count.sort_values(

     by

    =

     'total'

    ,

     ascending

    =False)[:

     10

    ]
# 复购率
    re_buy_rate = total_buy_count[total_buy_count>=

     2

    ].count()/total_buy_count.count()
SELECT user_id, COUNT(type) total_buy_countFROM behavior_sqlWHERE type = 'pay'GROUP BY user_idORDER BY COUNT(type) DESCLIMIT 10
CREAT VIEW v_buy_countAS SELECT user_id, COUNT(type) total_buy_countFROM behavior_sqlWHERE type = 'pay'GROUP BY user_id;
SELECT CONCAT(ROUND((SUM(CASE WHEN total_buy_count>=2 THEN 1 ELSE 0 END)/SUM(CASE WHEN total_buy_count>0 THEN 1 ELSE 0 END))*100,2),'%') AS re_buy_rateFROM v_buy_count;
topbuyer10.reset_index().style.bar(color='skyblue',subset=['total'])
output
tbc_box = total_buy_count.reset_index()fig, ax = plt.subplots(figsize=[16,6])ax.set_yscale("log")sns.countplot(x=tbc_box['total'],data=tbc_box,palette='Set1')for p in ax.patches: ax.annotate('{:.2f}%'.format(100*p.get_height()/len(tbc_box['total'])), (p.get_x() - 0.1, p.get_height()))plt.title('用户消费总次数')
output
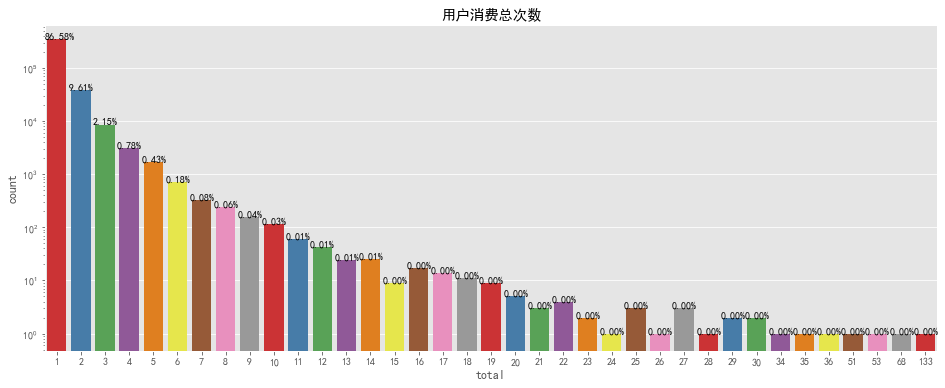
整个计算周期内,最高购物次数为133次,最低为1次,大部分用户的购物次数在6次以下,可适当
增加推广,完善购物体验,提高用户消费次数。
购物次数前10用户为1187177、502169等,应
提高其满意度,增大留存率。
print('复购率为 %.3f%%' %(re_buy_rate * 100))
output
复购率较低
,应加强
老用户召回机制,提升购物体验
,也可能因数据量较少,统计周期之内的数据 无法解释完整的购物周期,从而得出结论有误。
3、用户行为在时间纬度的分布
日消费次数、日活跃人数、日消费人数、日消费人数占比、消费用户日人均消费次数
daily_active_user = behavior.groupby('date')['user_id'].nunique()daily_buy_user = behavior[behavior['type'] == 'pay'].groupby('date')['user_id'].nunique()proportion_of_buyer = daily_buy_user / daily_active_userdaily_buy_count = behavior[behavior['type'] == 'pay'].groupby('date')['type'].count()consumption_per_buyer = daily_buy_count / daily_buy_user
SELECT date, COUNT(type) pay_daily FROM behavior_sqlWHERE type = 'pay'GROUP BY date;SELECT date, COUNT(DISTINCT user_id) uv_daily FROM behavior_sqlGROUP BY date;SELECT date, COUNT(DISTINCT user_id) user_pay_daily FROM behavior_sqlWHERE type = 'pay'GROUP BY date;
SELECT(SELECT date, COUNT(DISTINCT user_id) user_pay_daily FROM behavior_sqlWHERE type = 'pay'GROUP BY date) /(SELECT date, COUNT(DISTINCT user_id) uv_daily FROM behavior_sqlGROUP BY date)SELECT(SELECT date, COUNT(type) pay_daily FROM behavior_sqlWHERE type = 'pay'GROUP BY date) /(SELECT date, COUNT(DISTINCT user_id) uv_daily FROM behavior_sqlGROUP BY date)
# 日消费人数占比可视化# 柱状图数据pob_bar = (pd.merge(daily_active_user,daily_buy_user,on='date').reset_index()           .rename(columns={'user_id_x':'日活跃人数','user_id_y':'日消费人数'})           .set_index('date').stack().reset_index().rename(columns={'level_1':'Variable',0: 'Value'}))# 线图数据pob_line = proportion_of_buyer.reset_index().rename(columns={'user_id':'Rate'})
fig1 = plt.figure(figsize=[16,6])ax1 = fig1.add_subplot(111)ax2 = ax1.twinx()
sns.barplot(x='date', y='Value', hue='Variable', data=pob_bar, ax=ax1, alpha=0.8, palette='husl')ax1.legend().set_title('')ax1.legend().remove()
sns.pointplot(pob_line['date'], pob_line['Rate'], ax=ax2,markers='D', linestyles='--',color='teal')x=list(range(0,16))for a,b in zip(x,pob_line['Rate']):    plt.text(a+0.1, b + 0.001, '%.2f%%' % (b*100), ha='center', va= 'bottom',fontsize=12)
fig1.legend(loc='upper center',ncol=2)plt.title('日消费人数占比')
output
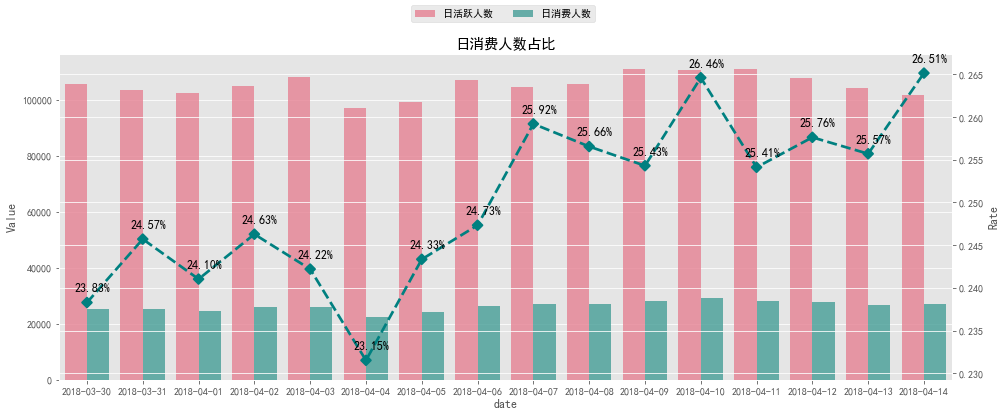
日活跃人数与日消费人数无明显波动,
日消费人数占比均在20%以上。
cpb_bar = (daily_buy_count.reset_index().rename(columns={'type':'Num'}))cpb_line = (consumption_per_buyer.reset_index().rename(columns={0:'Frequency'}))
fig2 = plt.figure(figsize=[16,6])ax3 = fig2.add_subplot(111)ax4 = ax3.twinx()
sns.barplot(x='date', y='Num', data=cpb_bar, ax=ax3, alpha=0.8, palette='pastel')sns.pointplot(cpb_line['date'], cpb_line['Frequency'], ax=ax4, markers='D', linestyles='--',color='teal')
x=list(range(0,16))for a,b in zip(x,cpb_line['Frequency']): plt.text(a+0.1, b + 0.001, '%.2f' % b, ha='center', va= 'bottom',fontsize=12)plt.title('消费用户日人均消费次数')
output
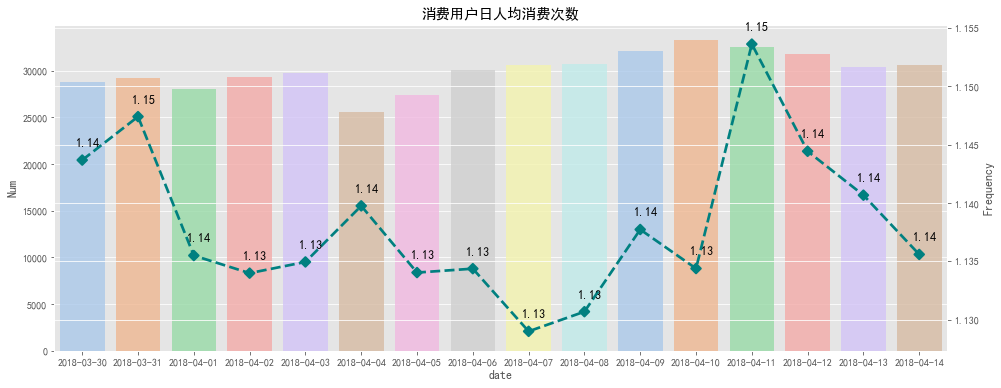
日消费人数在25000以上,日人均消费次数大于1次。
dau3_df = behavior.groupby(['date','user_id'])['type'].count().reset_index()dau3_df = dau3_df[dau3_df['type'] >= 3]
dau3_num = dau3_df.groupby('date')['user_id'].nunique()
SELECT date, COUNT(DISTINCT user_id)FROM(SELECT date, user_id, COUNT(type)FROM behavior_sqlGROUP BY date, user_idHAVING COUNT(type) >= 3) dau3GROUP BY date;
fig, ax = plt.subplots(figsize=[16,6])sns.pointplot(dau3_num.index, dau3_num.values, markers='D', linestyles='--',color='teal')x=list(range(0,16))for a,b in zip(x,dau3_num.values): plt.text(a+0.1, b + 300 , '%i' % b, ha='center', va= 'bottom',fontsize=14)plt.title('每日高活跃用户数')
output
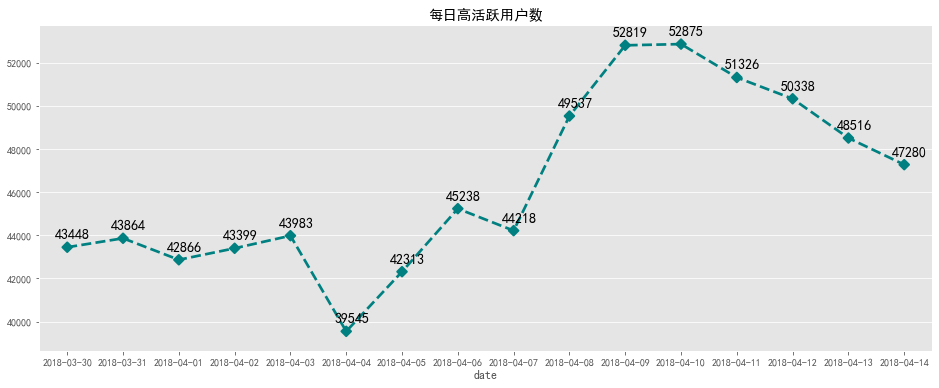
每日高活跃用户数
在大部分4万以上,2018-04-04之前数量比较平稳,之后数量一直攀升,8号9号达到最高,随后下降,推测
数据波动应为营销活动产生的。
dau3_cumsum = dau3_df.groupby('user_id')['date'].count()
SELECT user_id, COUNT(date)FROM(SELECT date, user_id, COUNT(type)FROM behavior_sqlGROUP BY date, user_idHAVING COUNT(type) >= 3) dau3GROUP BY user_id;
fig, ax = plt.subplots(figsize=[16,6])ax.set_yscale("log")sns.countplot(dau3_cumsum.values,palette='Set1')for p in ax.patches: ax.annotate('{:.2f}%'.format(100*p.get_height()/len(dau3_cumsum.values)), (p.get_x() + 0.2, p.get_height() + 100))plt.title('高活跃用户累计活跃天数分布')
output
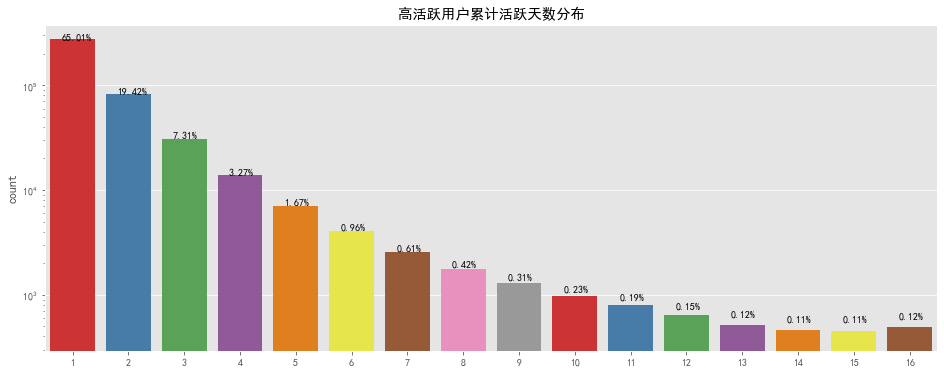
统计周期内,大部分高活跃用户
累计活跃天数
在六天以下,但也存在高达十六天的超级活跃用户数量,对累计天数较高的用户要推出连续登录奖励等继续
维持其对平台的黏性
,对累计天数较低的用户要适当进行推送活动消息等对其进行召回。
pv_daily = behavior[behavior['type'] == 'pv'].groupby('date')['user_id'].count()uv_daily = behavior.groupby('date')['user_id'].nunique()
SELECT date, COUNT(type) pv_daily FROM behavior_sqlWHERE type = 'pv'GROUP BY date;SELECT date, COUNT(DISTINCT user_id) uv_daily FROM behavior_sqlGROUP BY date;
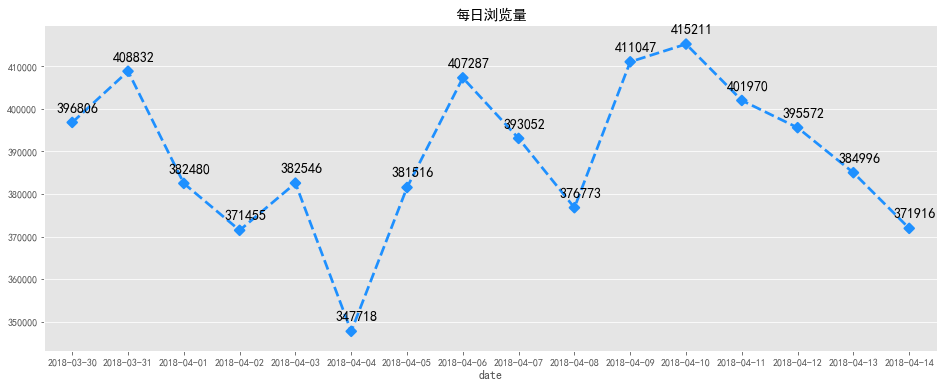
fig, ax = plt.subplots(figsize=[16,6])sns.pointplot(pv_daily.index, pv_daily.values,markers='D', linestyles='--',color='dodgerblue')x=list(range(0,16))for a,b in zip(x,pv_daily.values): plt.text(a+0.1, b + 2000 , '%i' % b, ha='center', va= 'bottom',fontsize=14)plt.title('每日浏览量')
output
fig, ax = plt.subplots(figsize=[16,6])sns.pointplot(uv_daily.index, uv_daily.values, markers='H', linestyles='--',color='m')x=list(range(0,16))for a,b in zip(x,uv_daily.values): plt.text(a+0.1, b + 500 , '%i' % b, ha='center', va= 'bottom',fontsize=14)plt.title('每日访客数')


