正文
plt
.
subplot
(
211
)
# 第一张图中的第一张子图
plt
.
plot
([
1
,
2
,
3
])
plt
.
subplot
(
212
)
# 第一张图中的第二张子图
plt
.
plot
([
4
,
5
,
6
])
plt
.
figure
(
2
)
# 第二张图
plt
.
plot
([
4
,
5
,
6
])
# 默认创建子图subplot(111)
plt
.
figure
(
1
)
# 切换到figure 1 ; 子图subplot(212)仍旧是当前图
plt
.
subplot
(
211
)
# 令子图subplot(211)成为figure1的当前图
plt
.
title
(
'Easy as 1,2,3'
)
# 添加subplot 211 的标题

figure感觉就是给图像ID,之后可以索引定位到它。
plt.text()添加文字说明
import numpy
as
np
import
matplotlib
.
pyplot
as
plt
mu
,
sigma
=
100
,
15
x
=
mu
+
sigma *
np
.
random
.
randn
(
10000
)
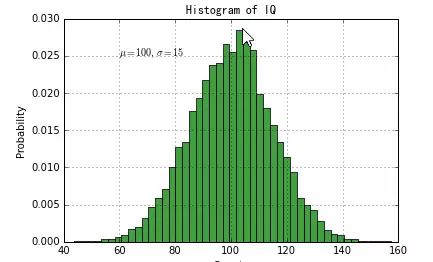
# 数据的直方图
n
,
bins
,
patches
=
plt
.
hist
(
x
,
50
,
normed
=
1
,
facecolor
=
'g'
,
alpha
=
0.75
)
plt
.
xlabel
(
'Smarts'
)
plt
.
ylabel
(
'Probability'
)
#添加标题
plt
.
title
(
'Histogram of IQ'
)
#添加文字
plt
.
text
(
60
,
.
025
,
r
'$mu=100, sigma=15$'
)
plt
.
axis
([
40
,
160
,
0
,
0.03
])
plt
.
grid
(
True
)
plt
.
show
()
text中前两个参数感觉应该是文本出现的坐标位置。
plt.annotate()文本注释
在数据可视化的过程中,图片中的文字经常被用来注释图中的一些特征。使用annotate()方法可以很方便地添加此类注释。在使用annotate时,要考虑两个点的坐标:被注释的地方xy(x, y)和插入文本的地方xytext(x, y)。1
import numpy
as
np
import
matplotlib
.
pyplot
as
plt
ax
=
plt
.
subplot
(
111
)
t
=
np
.
arange
(
0.0
,
5.0
,
0.01
)
s
=
np
.
cos
(
2
*
np
.
pi*
t
)
line
,
=
plt
.
plot
(
t
,
s
,
lw
=
2
)
plt
.
annotate
(
'local max'
,
xy
=
(
2
,
1
),
xytext
=
(
3
,
1.5
),
arrowprops
=
dict
(
facecolor
=
'black'
,
shrink
=
0.05
),
)
plt
.
ylim
(
-
2
,
2
)
plt
.
show
()

plt.xticks()/plt.yticks()设置轴记号
现在是明白干嘛用的了,就是人为设置坐标轴的刻度显示的值。
# 导入 matplotlib 的所有内容(nympy 可以用 np 这个名字来使用)
from pylab import *
# 创建一个 8 * 6 点(point)的图,并设置分辨率为 80
figure


