正文
HEA中各组分间的协调作用有效调节d波段中心,分布更广泛的d带中心模型促进了高熵材料表面大量的不同状态的催化中心。
水合锌离子的去溶剂化步骤得以被高熵界面层上丰富的高催化活性位点催化。并且结合理论计算分析,高熵材料对于每一步的脱溶过程都有明显促进作用且展示出完全去溶剂化的能力,这是常规的单金属催化剂无法实现的。这种高效的去溶剂化过程抑制了不利的界面副反应,提高了锌金属阳极的可逆性。此外,高熵材料的亲锌位点也可用于锌原子沉积反应的催化剂进而降低锌沉积反应的能垒,实现锌负极上的致密和均匀的沉积层。因此,该负极实现了稳定的循环性能。组装的全电池也都实现了明显提升的电化学性能。
该成果发表在国际顶级期刊《Energy & Environmental Science》上。第一作者是:李彦昕。
【图文导读】
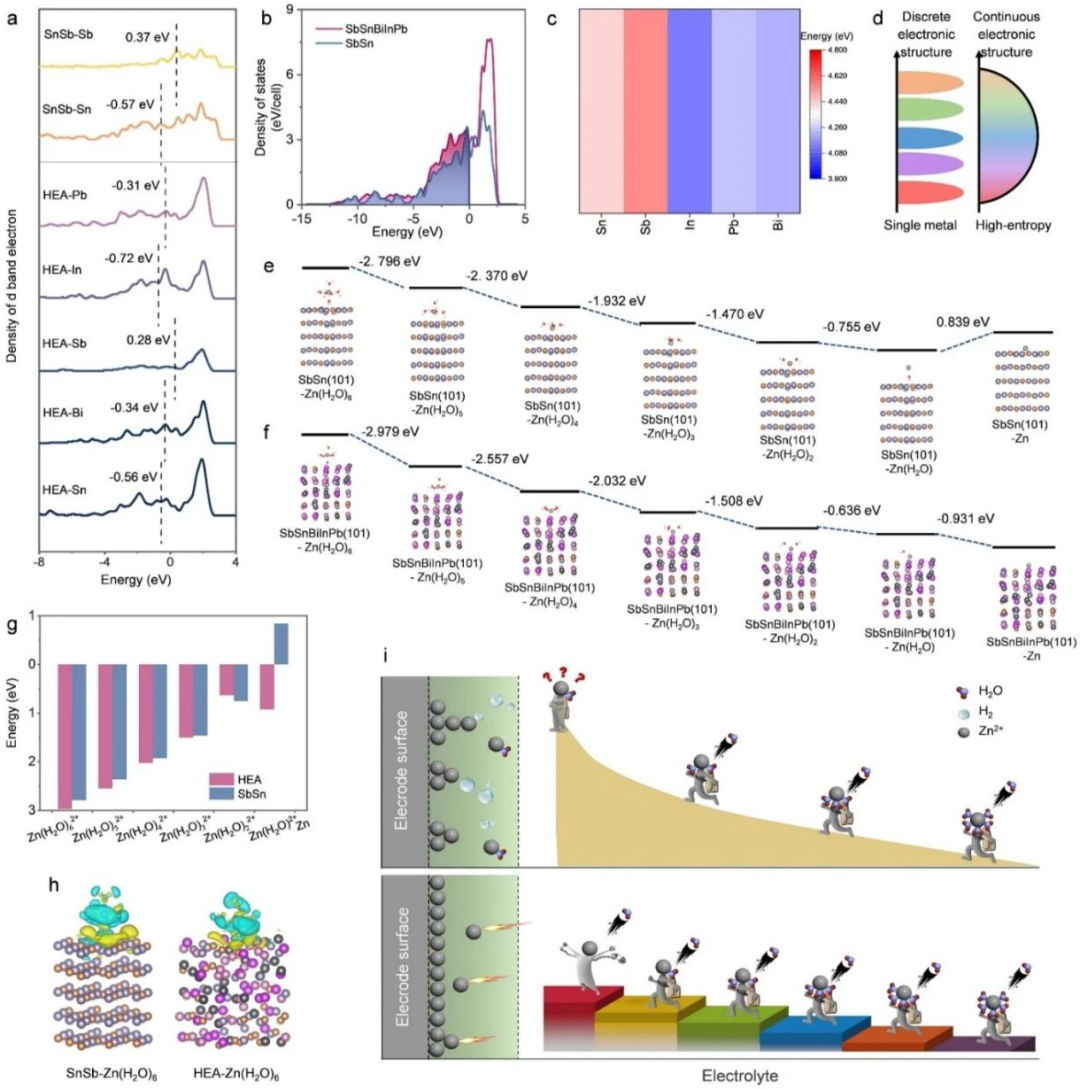 Fig. 1
(a) D-band center of each element in HEA and SbSn. (b) D-band distribution of HEA and SbSn. (c) Work functions of various metals in HEA. (d)
Schematic diagram of the d-band center for unary material and high-entropy material.
Energy during the sequential desolvation of (e) SbSn
and (f) SbSnBiInPb. (g) Energy changes of SbSn and SbSnBiInPb. Charge density distribution of (h) SbSn(101)-Zn(H
2
O)
6
and SbSnBiInPb(101)-Zn(H
2
O)
6
. (i) Schematic diagram of HEA in graded and complete desolvation.
Fig. 1
(a) D-band center of each element in HEA and SbSn. (b) D-band distribution of HEA and SbSn. (c) Work functions of various metals in HEA. (d)
Schematic diagram of the d-band center for unary material and high-entropy material.
Energy during the sequential desolvation of (e) SbSn
and (f) SbSnBiInPb. (g) Energy changes of SbSn and SbSnBiInPb. Charge density distribution of (h) SbSn(101)-Zn(H
2
O)
6
and SbSnBiInPb(101)-Zn(H
2
O)
6
. (i) Schematic diagram of HEA in graded and complete desolvation.
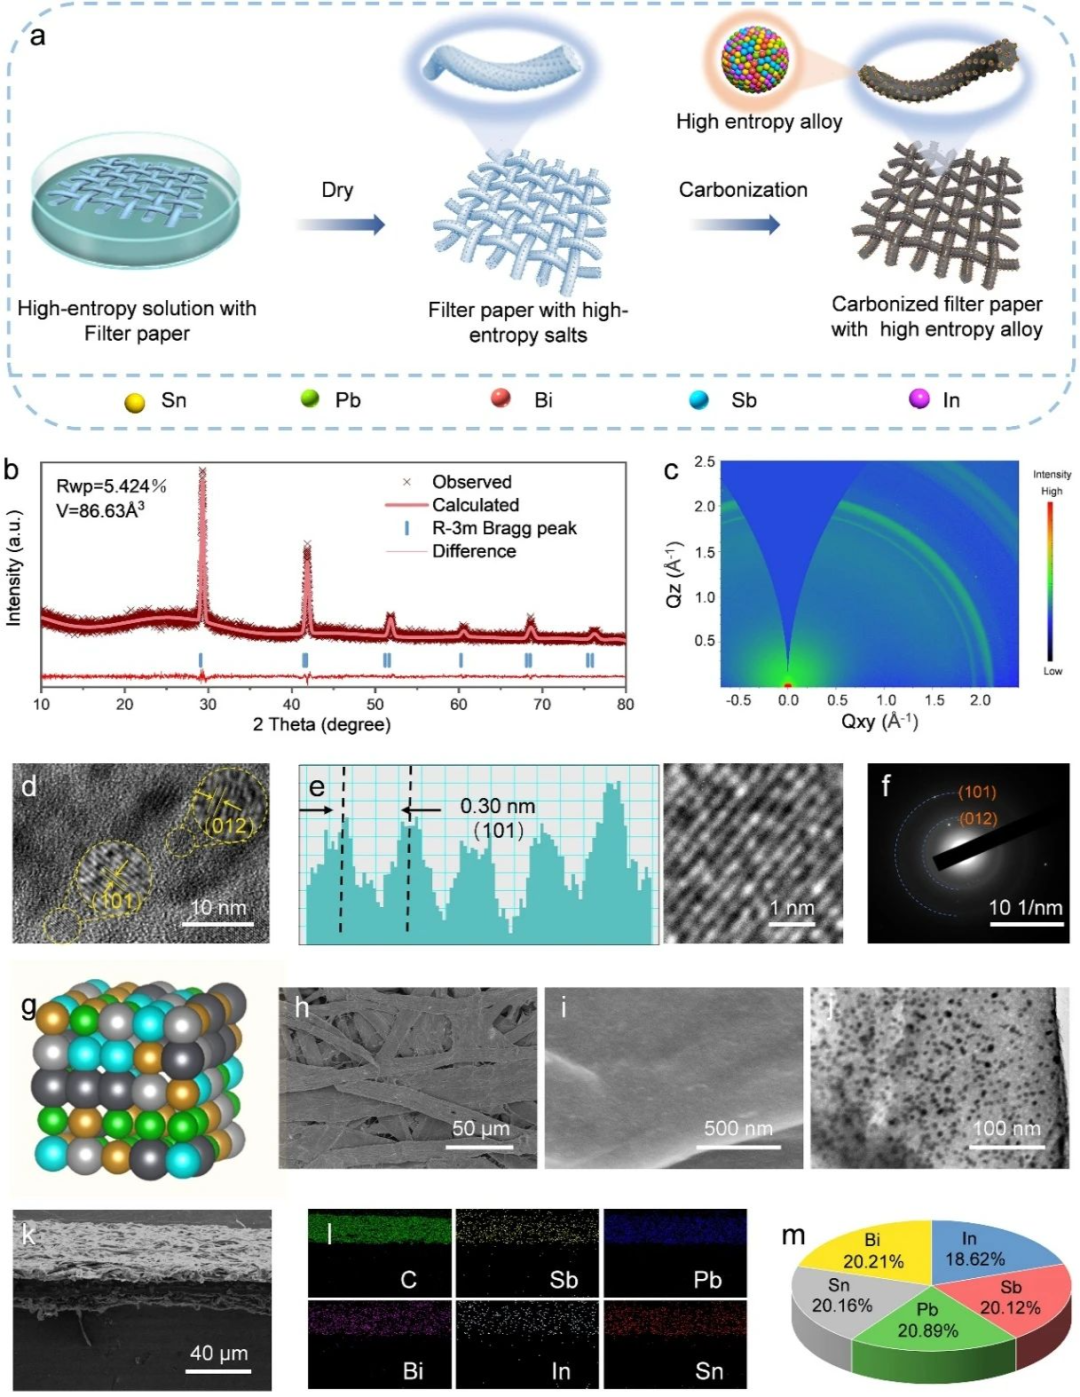 Fig. 2
(a) Synthesis schematic of HEA-CFP.
(b) XRD Rietveld refinement pattern of HEA-CFP. (c) Grazing-incidence wide-angle X-ray scattering (GIWAXS) of of HEA-CFP. (d) Magnified HR-TEM image of HEA-CFP. (e) Fast Fourier transformation (FFT) patterns of HEA-CFP. (f) Selected area electron diffraction (SAED) of HEA-CFP. (g, h) SEM images and (i) TEM image of HEA-CFP. (j) Crystal structure of HEA-CFP. (k, l) Side view SEM image and corresponding elemental mapping images of HEA-CFP. (m) Elemental content in HEA-CFP.
Fig. 2
(a) Synthesis schematic of HEA-CFP.
(b) XRD Rietveld refinement pattern of HEA-CFP. (c) Grazing-incidence wide-angle X-ray scattering (GIWAXS) of of HEA-CFP. (d) Magnified HR-TEM image of HEA-CFP. (e) Fast Fourier transformation (FFT) patterns of HEA-CFP. (f) Selected area electron diffraction (SAED) of HEA-CFP. (g, h) SEM images and (i) TEM image of HEA-CFP. (j) Crystal structure of HEA-CFP. (k, l) Side view SEM image and corresponding elemental mapping images of HEA-CFP. (m) Elemental content in HEA-CFP.
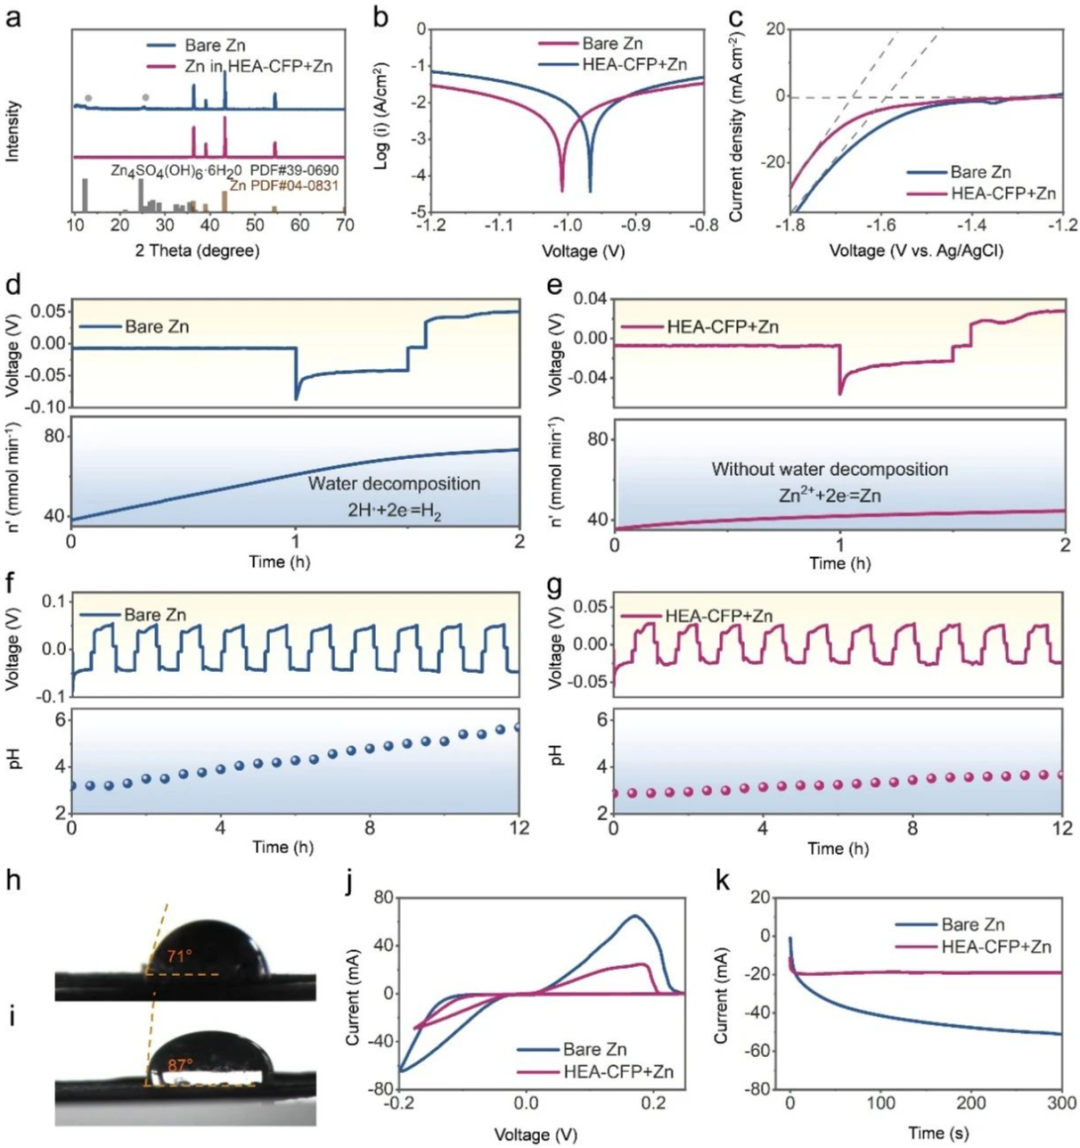
Fig. 3
(a) XRD patterns
of the bare Zn and zinc anode in HEA-CFP+Zn after immersion in the electrolyte for 7 days.
(b) Polarization curves. (c) Linear sweep voltammetry (LSV) curves. In-situ hydrogen production testing in the electrochemical deposition of (d) bare Zn and (e) HEA-CFP+Zn cells. pH changes of electrolyte during in-situ electrochemical testing in (f) bare Zn and (g) HEA-CFP+Zn cells. Contact angles the electrolyte on (h) HEA-CFP (above) and (i) bare Zn (below). (j)
Voltammetry (CV) curves
. (k) Chronoamperometry (CA) curves.
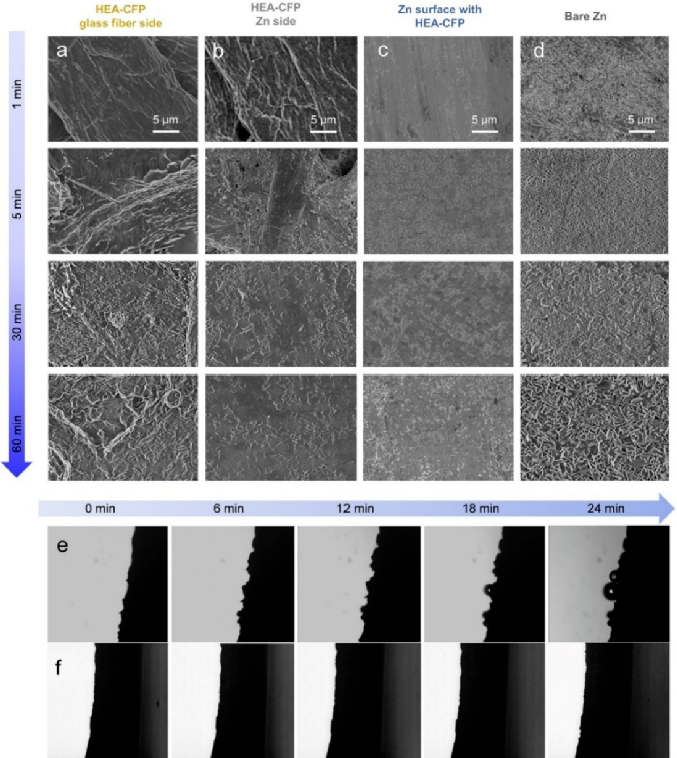
Fig.
4
SEM images of
HEA-CFP+Zn on
(a) separator side, (b) Zn side, (c) Zn surface, and (d) bare Zn after depositing at different times. Optical images for in-situ deposition test of (e) bare Zn and (f) HEA-CFP.
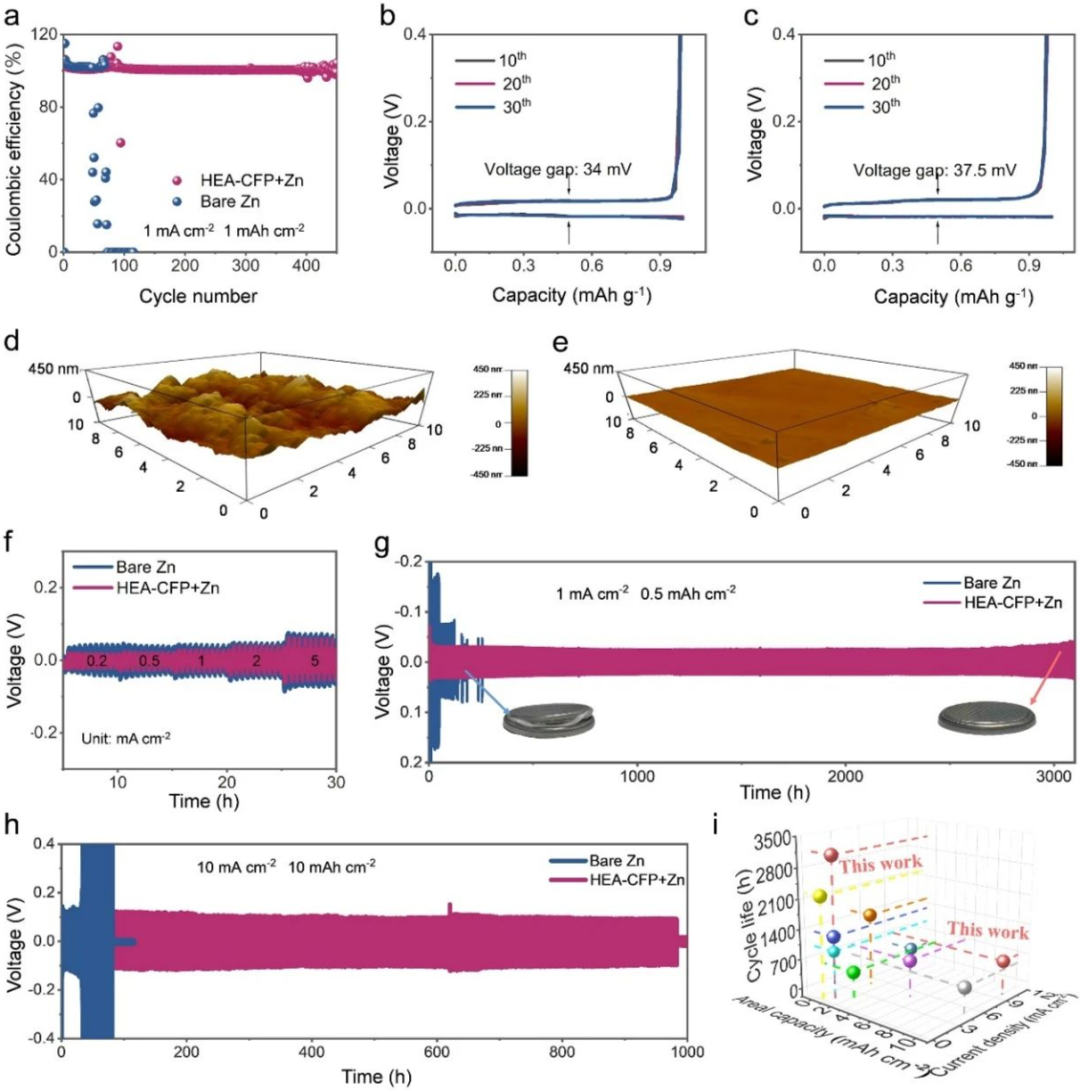
Fig. 5
(a)
CE test and the corresponding polarization voltage curves of


