正文
AAPL[column_name]
=
pd.rolling_mean(AAPL[
"Adj Close"
],ma)
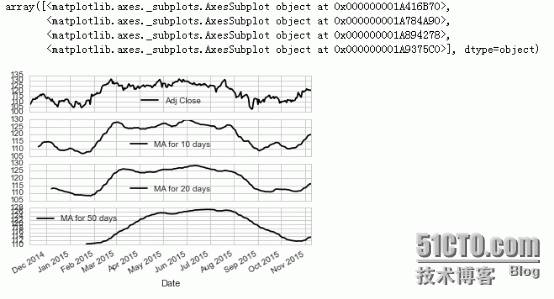
瞧瞧效果

默认subplots这个参数是False的,这里我们瞧瞧True的情况
|
1
|
AAPL[[
"Adj Close"
,
"MA for 10 days"
,
"MA for 20 days"
,
"MA for 50 days"
]].plot(subplots
=
True
)
|

|
1
|
AAPL[[
"Adj Close"
,
"MA for 10 days"
,
"MA for 20 days"
,
"MA for 50 days"
]].plot(figsize
=
(
10
,
4
))
|
很好看有没有!!!

让我们新建一个字段叫做“Dailly Return”,注意Dailly其实我写错了,Dailly Return其实是每日较于前一日的涨幅率.
|
1
2
3
|
AAPL[
"Dailly Return"
]
=
AAPL[
"Adj Close"
].pct_change()
AAPL[
"Dailly Return"
].plot(figsize
=
(
10
,
4
),legend
=
True
)
|

|
1
2
|
AAPL[
"Dailly Return"
].plot(figsize
=
(
10
,
4
),legend
=
True
,linestyle
=
"--"
,marker
=
"o"
)
|

|
1
2
|
sns.kdeplot(AAPL[
"Dailly Return"
].dropna())
|

注:This function combines the matplotlib
hist
function (with automatic calculation of a good default bin size) with the seaborn
kdeplot()
and
rugplot()
functions.
由官方说明可知,displot函数是由直方图与seaborn的核密度图以及rugplot(
Plot datapoints in an array as sticks on an axis.
)组合
|
1
2
|
sns.distplot(AAPL[
"Dailly Return"
].dropna(),bins
=
100
)
|

|
1
2
3
|
closing_df
=
DataReader(stock_lis,
"yahoo"
,start,end)[
"Adj Close"
]
closing_df.head()
|

|
1
2
3
|
tech_rets
=
closing_df.pct_change()
tech_rets.head()
|

AAPL 0.000456
AMZN 0.003203
GOOG 0.001282
MSFT 0.000623
dtype: float64
我们来瞧瞧jointplot这个函数,通过这个函数我们可以画出两个公司的”相关性系数“,或者说皮尔森相关系数(http://baike.baidu.com/view/3028699.htm),如下图所示
如果你看过《大数据时代》这本书,你就会知道为什么作者会求两个公司的相关性了,书中有提到的一个观点是,在大数据时代的到来,我们可以通过大数据来描绘事物之间的相关性并预测,而为什么,是后面要研究的事,注重相关性而不是因果关系。(个人读后感,如有偏驳还望指正)
下面这一部分主要在说相关性~
|
1
|
sns.jointplot(
"GOOG"
,
"GOOG"
,tech_rets,kind
=
"hex"
)
|

如上图所示,我们画出的事google与google自己的皮尔森相关系数,当然是1啦!值得说明的皮尔森相关系数的值在-1到1之间,1代表正相关,-1代表负相关,0代表没有任何相关性,有兴趣了解怎么算的,参考:https://en.wikipedia.org/wiki/Pearson_product-moment_correlation_coefficient
|
1
|
sns.jointplot(
"GOOG"
,
"GOOG"
,tech_rets,kind
=
"scatter"
)
|


