正文
Regular PCs or the laptop I used to type this article cannot analyze data of this size. Instead, it is analyzed with the use of supercomputers that boast amazing computational powers. The supercomputers at the National Oceanic and Atmospheric Administration can complete 2.8 quadrillion calculations (yes, you read that correctly. 1 Quadrillion is 1015) every second! Scientists use these supercomputers to generate forecasts. They also use mathematical models that are based on past weather patterns and the geography of that particular region.
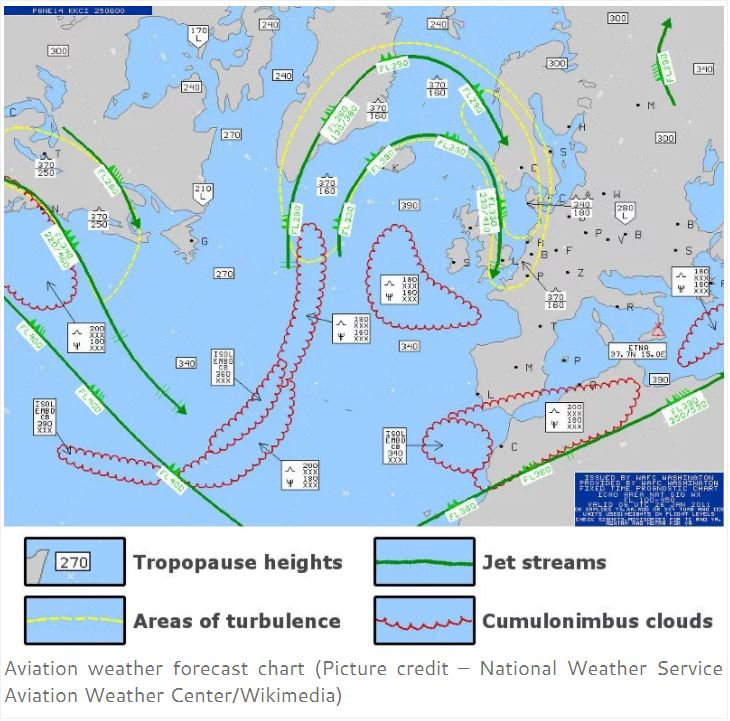
Below is an image of what a regular forecast chart looks like. The yellow dashed line represents areas of moderate or high turbulence, while the scalloped lines represent cumulonimbus clouds, which are basically thunderstorm clouds. These areas have higher chances of storms and hails. The green lines indicate jet streams, which are near the core of maximum winds.
What is this ‘observational data’?


