正文
import json

from pyecharts import options as opts
from pyecharts.charts import Sankey

with open("product.json", "r", encoding="utf-8") as f:   # 导入json数据
    j = json.load(f)    # json数据转成字典数据
c = (
    Sankey()
    .add(
        "sankey",
        nodes=j["nodes"],   # 取出json数据的节点和链路数据
        links=j["links"],
        pos_top="10%",
        focus_node_adjacency=True,
        levels=[
            opts.SankeyLevelsOpts(
                depth=0,
                itemstyle_opts=opts.ItemStyleOpts(color="#fbb4ae"),
                linestyle_opts=opts.LineStyleOpts(color="source", opacity=0.6),
            ),
            opts.SankeyLevelsOpts(
                depth=1,
                itemstyle_opts=opts.ItemStyleOpts(color="#b3cde3"),
                linestyle_opts=opts.LineStyleOpts(color="source", opacity=0.6),
            ),
            opts.SankeyLevelsOpts(
                depth=2,
                itemstyle_opts=opts.ItemStyleOpts(color="#ccebc5"),
                linestyle_opts=opts.LineStyleOpts(color="source", opacity=0.6),
            ),
            opts.SankeyLevelsOpts(
                depth=3,
                itemstyle_opts=opts.ItemStyleOpts(color="#decbe4"),
                linestyle_opts=opts.LineStyleOpts(color="source", opacity=0.6),
            ),
        ],
        linestyle_opt=opts.LineStyleOpts(curve=0.5),
    )
    .set_global_opts(
        title_opts=opts.TitleOpts(title="Sankey-Level Settings"),
        tooltip_opts=opts.TooltipOpts(trigger="item", trigger_on="mousemove"),
    )
#    .render("sankey_with_level_setting.html")
)

c.render_notebook()   # 在线显示
-
读取本地的
json
数据,通过
josn.load()
读取转成
Python
字典
-
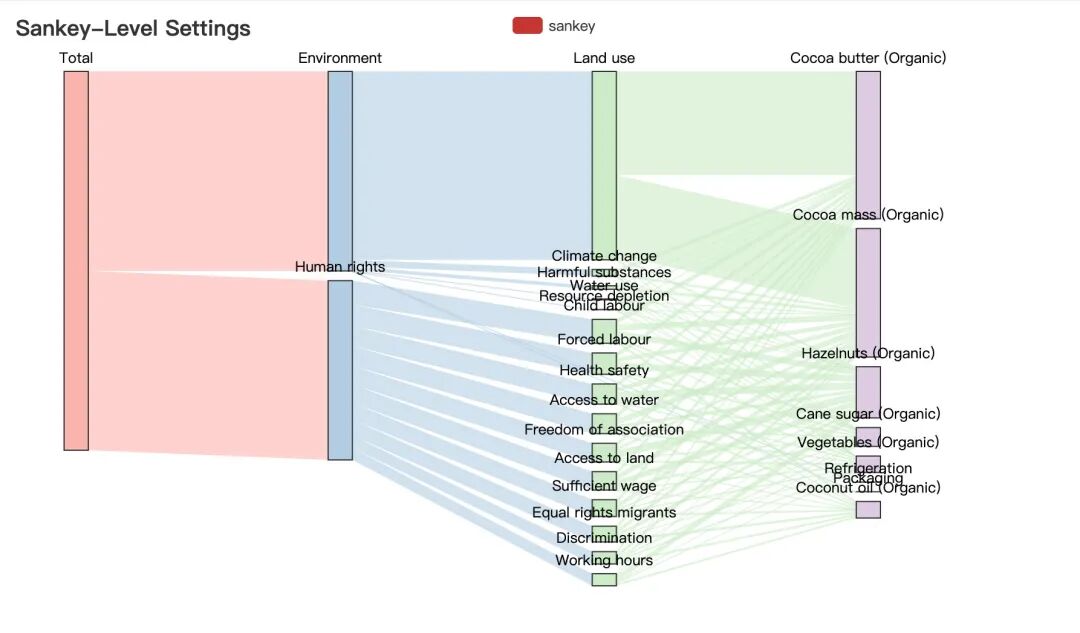
桑基图绘制实践
原始数据整理
通过上面官网的例子我们明白了绘制桑基图需要的两个数据:
节点数据+链路数据
,下面👇通过一个实际的案例来讲解如何生成绘制桑基图需要的数据
认识原始数据
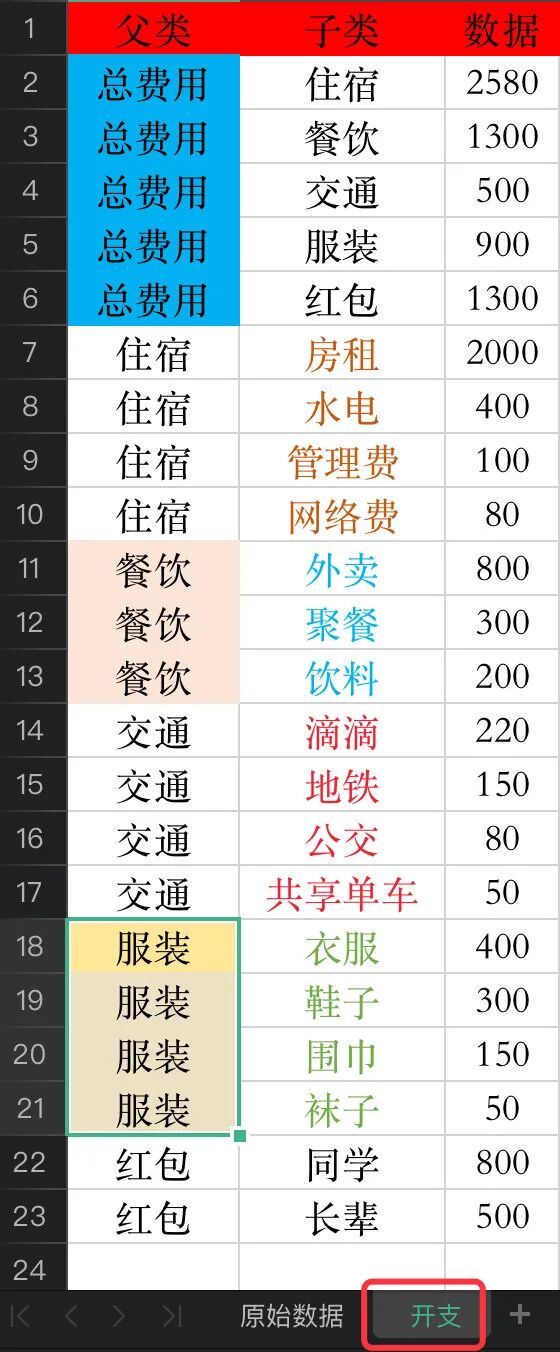
Peter同学一个人在深圳搬砖,辛辛苦苦地搬了一个月,产生很多的开销😭,这些开支主要分成5大块:
每个部分又分别有不同的去向,所以这些数据就自然构成了一条条的链路,比如:
总费用—住宿—房租(2000)
,
总费用—交通—滴滴(220)
等,
我们只考虑两个节点之间的关系
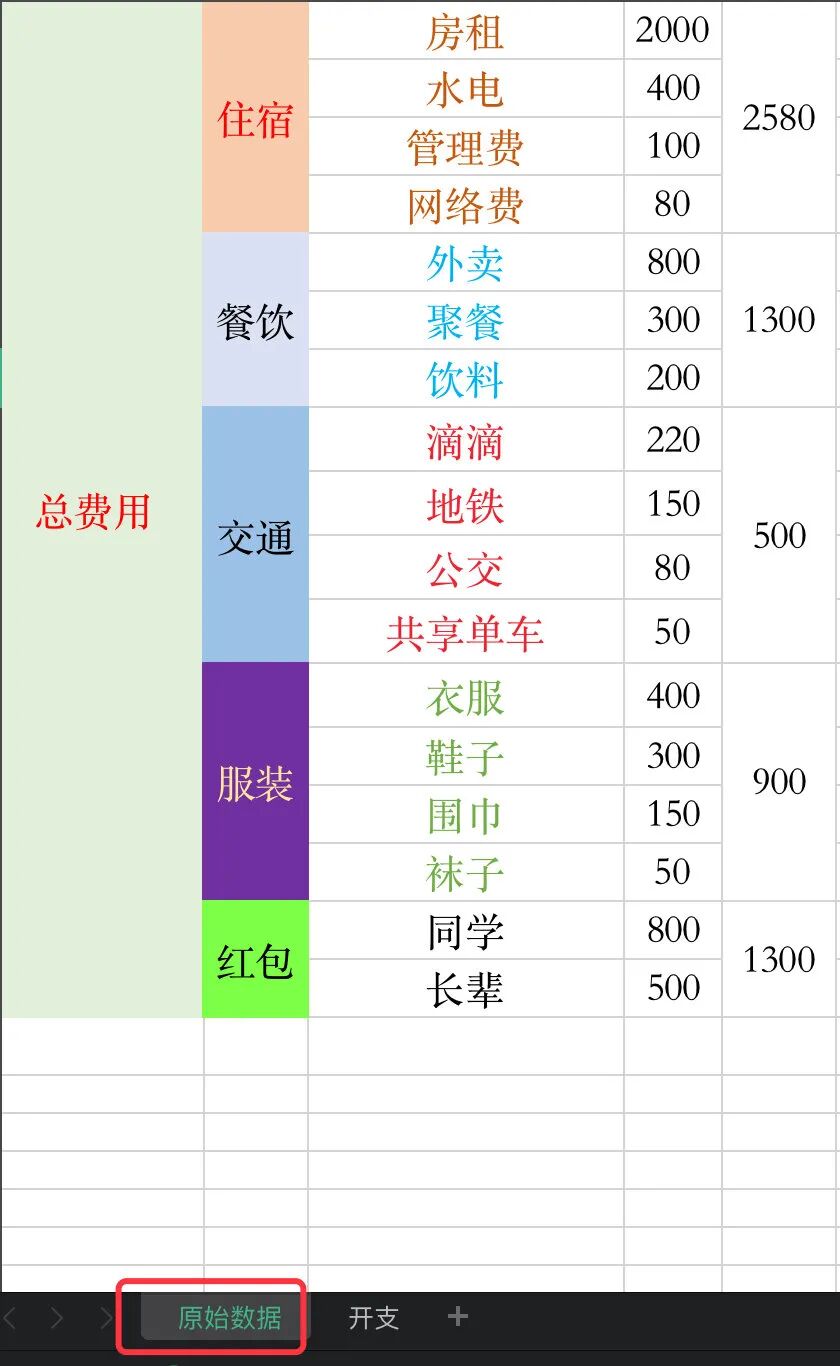
分层级整理数据
1、接下来我们分不同的层级来整理原始数据,首先是第一层:
总费用到5个子版块
。算出每个子版块的总和
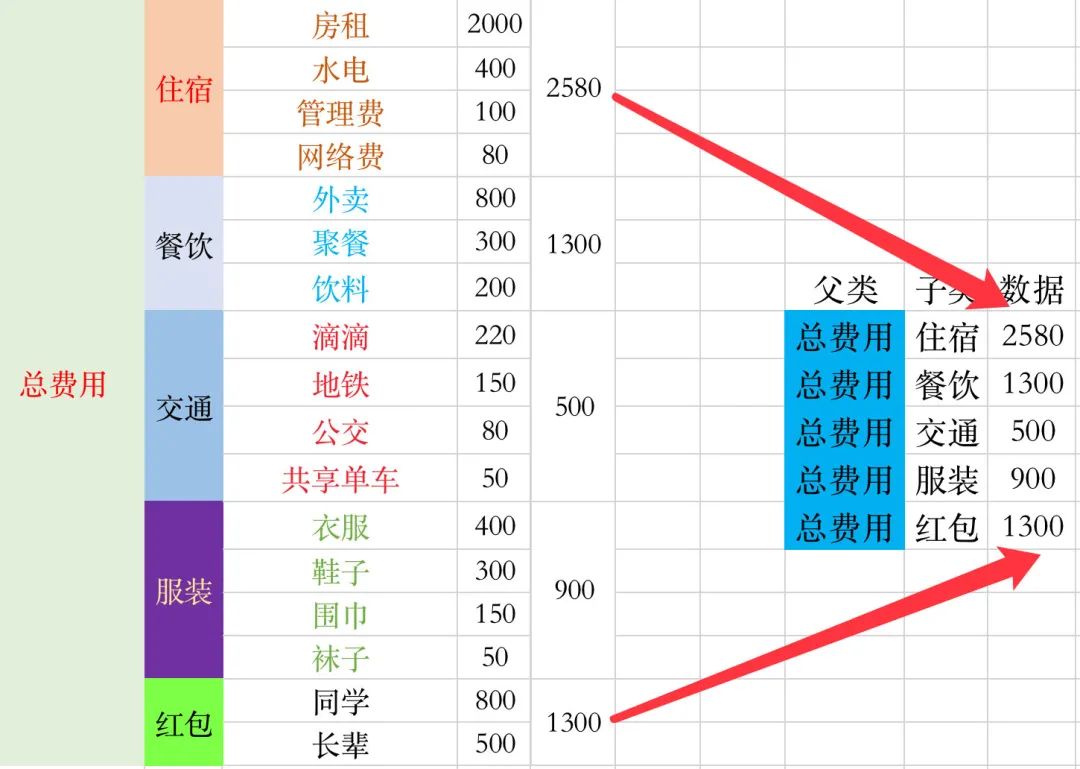
2、整理5个子版块的数据
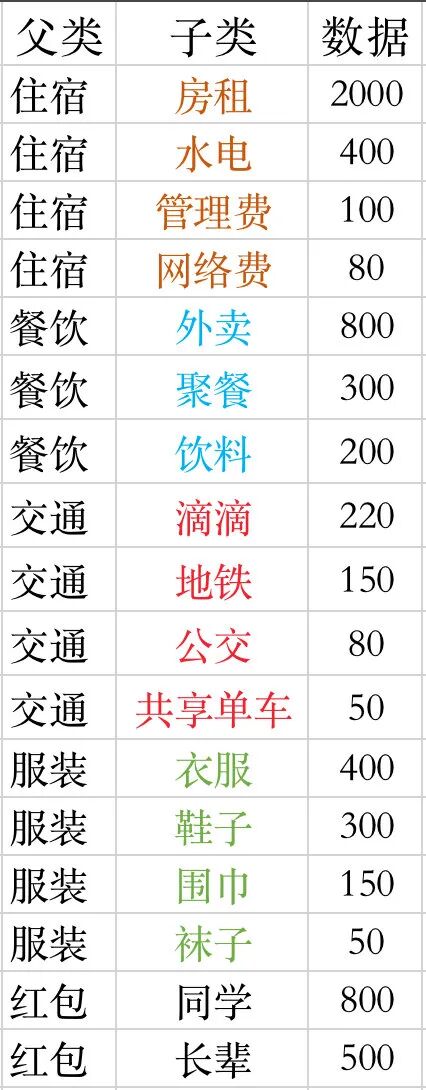
3、我们将上面两个步骤得到的数据放入一个
sheet
中,命名为
开支
:
桑基图数据生成
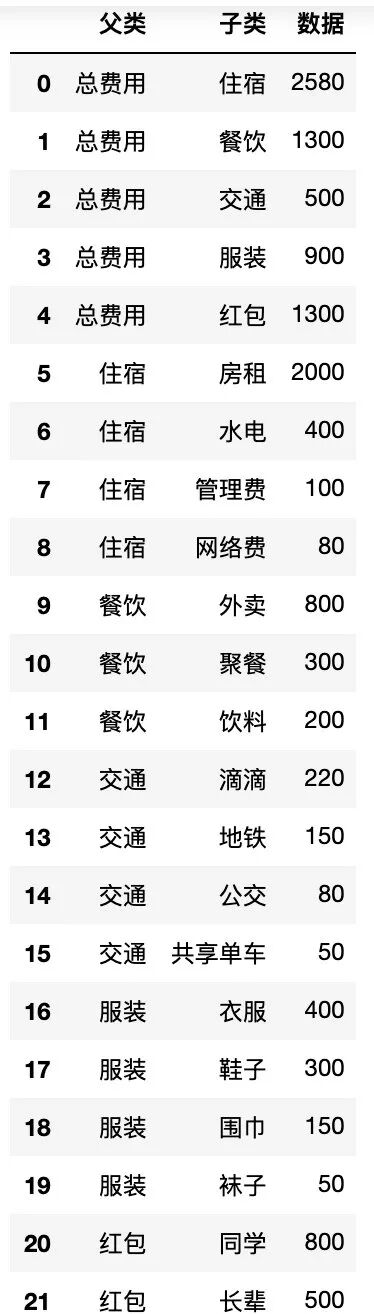
读取数据
首先我们将上面制作好的
开支
这份数据读到pandas中:
import pandas as pd
import numpy as np
import json

# 等价于:data = pd.read_excel("life.xlsx",sheet_name=1)  1表示sheet_name的索引位置,索引从0开始
df = pd.read_excel("life.xlsx",sheet_name="开支")  # 直接写名字
df.head()
注意两点:
-
当一个表格中存在多个
sheet
的时候,我们需要指定
sheet_name
的名字
-
-
-
确定全部节点nodes
1、先找出全部的节点
所有的节点数据就是上面的
父类和子类中去重后的元素
,我们使用集合
set
进行去重,再转成列表
# 父类+子类中的数据,需要去重

df['父类'].tolist()
df['子类'].tolist()
将上面的数据相加并且去重:
# 将两个列表相加,在转成集合set进行元素去重,再转成列表


